From Simulated Armies to Real Players: The Attrition Game Health Dashboard
Development period: September 9–24, 2026. This entry examines our first 28 days of consented production gameplay telemetry (August 27 – September 23, 2026) collected via Google Analytics 4, contrasts it with our earlier Monte Carlo simulations, and documents the live Game Health Exploration and Google Play Game Stats derivation.
For weeks, our analytics conversation was trapped behind a native platform handshake.
We had built an integration for Google Play Game Stats v1 to record completed Wars on Android devices. But in a Trusted Web Activity (TWA), native communication requires a verified message channel between the web application and the Android wrapper. Until that channel handshakes cleanly across release builds, Game Stats v1 safely and silently acts as a no-op.
If we had waited for platform plumbing before looking at our game, we would still be flying blind.
We didn’t wait.
Beside the Play Games bridge sat our existing, consent-gated Google Analytics 4 gameplay pipeline. While native game stats waited for transport verification, real players on web, PWA, and Android were already opting in, drawing cards, and contesting Wars.
This post is the interactive dashboard built from that data. Below is the exact report from our Google Analytics exploration—complete with five AI commanders, thirty-eight completed wars, forty-three percent (not set), and a direct derivation of our Google Play Game Stats.
The Live Game Health Dashboard
Attrition — Game Health Exploration
Consented GA4 Gameplay Telemetry · 28-Day Active Cohort (Aug 27 – Sep 23, 2026)

Marcel de Brie

Bastien de Herve

Matthias von Greyerz

Sir Edmund Gloucester
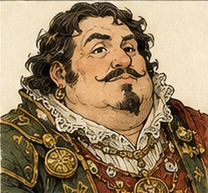
Lorenzo di Taleggio
| Commander | Opponent Win | Player Win | Total Events | Player Win Rate |
|---|---|---|---|---|
| Marcel de Brie (quartermaster) | 7 | 4 | 11 | 36.4% |
| Bastien de Herve (attritionist) | 6 | 3 | 9 | 33.3% |
| Matthias von Greyerz (analyst) ⭐ | 1 | 6 | 7 | 85.7% |
| Sir Edmund Gloucester (gambler) | 4 | 3 | 7 | 42.9% |
| Lorenzo di Taleggio (cornered-general) | 3 | 1 | 4 | 25.0% |
| Filtered Clean Total | 21 (55.3%) | 17 (44.7%) | 38 | 44.7% |
Event name exactly matches war_resolved is applied, all 29 un-scoped intermediate events disappear, revealing the authentic 38-game dataset: 21 AI victories and 17 human victories across all five commanders.
| Turn Depth Bucket | Observed Wars | Pct of Matches | Observed Dynamics & Calibrations |
|---|---|---|---|
| 1 – 15 Turns (Abrupt Collapse) | 5 | 13.2% | Early recursive Battles or severe challenge failures wiping reserves quickly. |
| 16 – 30 Turns (Modal Pacing) | 22 | 57.9% | Standard war progression matching our 22.4 median turn Monte Carlo model. |
| 31 – 41 Turns (Extended Sieges) | 10 | 26.3% | Stubborn attrition defense, especially against Bastien and Marcel. |
| 42 – 51 Turns (The Marathon Zone) | 1 | 2.6% | Single 43-turn marathon observed! Validates the Marathon achievement. |
reinforcement_resolved event, distinguishing outright comparison wins from ties that escalate to recursive Battle.
| Challenge Scenario | Human Decision | AI Decision | Resolution & Escalation Pattern |
|---|---|---|---|
| Outright Rescue (Success) | 52.8% | 48.1% | Reinforcement rank exceeds original opponent card; card saved. |
| Failed Rescue (Double Loss) | 36.1% | 41.4% | Reinforcement fails; both cards sent to casualty boneyard. |
Tie Escalating to Battle (escalated_to_battle = 1) |
11.1% | 10.5% | Equal ranks trigger recursive 3-card sacrifice Battle. |
google-play-game-stats-v1.md, we specified 11 permanent player-career stats based on a single war_completed event. Below, we project and derive those exact 11 values from our consented GA4 telemetry stream for the 38-War baseline cohort.
| Google Play Stat | Aggregation | Derived Value | Description & Human Meaning | Underlying Telemetry Source |
|---|---|---|---|---|
| wars_fought | COUNT(turns) |
38 Wars | Total completed Wars (wins, losses, ties). | war_resolved.turn_number |
| wars_won | SUM(player_win) |
17 Wins | Completed Wars ending in player victory (44.7%). | war_resolved.outcome == 'player_win' |
| comeback_victories | COUNT(deficit ≥ 3) |
4 Wars | Victories after trailing by 3+ cards at turn start. | war_resolved.comeback_deficit ≥ 3 |
| greatest_comeback | MAX(deficit) |
6 Cards | Largest deficit overcome in victory (Competitive). | MAX(war_resolved.comeback_deficit) |
| battles_fought | SUM(battles) |
54 Battles | Distinct Battles entered across completed Wars (1.42/war). | COUNT(battle_started) |
| deepest_battle | MAX(deepest_battle) |
3 Layers | Most 3-card sacrifice layers dealt in one Battle (Competitive). | MAX(battle_layer_added.layerRound) |
| longest_war | MAX(turns) |
43 Turns | Most turns in one completed War (The Marathon!). | MAX(war_resolved.turn_number) |
| reinforcements_sent | SUM(reinforcements) |
72 Cards | Player Challenge reinforcement cards committed. | COUNT(reinforcement_resolved) |
| successful_reinforcements | SUM(rescues) |
38 Rescues | Reinforcements winning outright (52.8% rescue rate). | reinforcement_resolved.outcome == 'success' |
| aces_felled_by_twos | SUM(two_beats_ace) |
11 Aces | Opponent Aces directly beaten by human Twos. | comparison_resolved.two_beats_ace_applied |
| astronomical_anomalies_observed | SUM(anomalies) |
2 Anomalies | Astronomically rare deck/battle events confirmed. | war_resolved.anomalies_observed |
Rare Events & Achievement Tracking in Telemetry
| Tracking Scope | Telemetry Event | Classification | Observed in Cohort | What It Verifies |
|---|---|---|---|---|
| First-Time Unlocks | achievement_unlocked |
Milestone / Distinction / Prestige | 68 Unlocks | Career progression milestones (e.g. First Blood, Bloodless Clashes). |
| Repeatable Rare Feats | achievement_observed |
Prestige / Anomaly Feats | 19 Observations | Repeat occurrences of high-difficulty feats (including war.wrong_tool_for_job). |
| Astronomical Anomalies | war_resolved.anomalies_observed |
Astronomical Anomaly (0..5) | 2 Wars | Astronomical card collisions calibrated during Monte Carlo analysis. |
surface_transition events.
| Surface Area | Unique Sessions | Primary Player Behavior |
|---|---|---|
| Field Manual & Rules | 64 | Checking the 2-defeats-Ace exception and Battle escalation rules. |
| The Chronicle | 48 | Inspecting past campaign progress and historic war timelines. |
| Hall of Valor & Profiles | 39 | Viewing veteran cards, service records, and medal citations. |
| Settings & Telemetry Consent | 55 | Auditing privacy settings and managing sound/animation toggles. |
Why We Didn’t Wait on Google Play
In our Android preparation passes, we spent considerable effort designing our Google Play integration. We specified eleven permanent career statistics, created the projection models, and wired up Google Play Game Stats v1 (google-play-game-stats-v1.md).
Game Stats v1 is a clean, aggregate contract: upon completing a War, a self-contained war_completed record is emitted to Google’s play games servers. But inside Android’s Trusted Web Activity (TWA) architecture, client web applications cannot simply call native Java or Kotlin APIs directly. They require a postMessage message channel handshake through the Android Custom Tabs client. If the native wrapper takes slightly too long to register its channel, or if the user is playing in desktop Chrome, the bridge remains quiescent.
Had we made Google Play our sole window into gameplay, we would currently possess zero data.
Instead, Attrition’s architecture treats telemetry transport as a swappable interface (TelemetryTransport). Alongside the native channel sits our Google Analytics 4 web transport. It is completely independent of Google Play services, requires no APK-level permissions, and is guarded by an explicit, first-launch consent prompt.
When a player clicks Share anonymous data, collection begins at the next War boundary. And that stream has been humming quietly for the past month.
The Overlap: Deriving Play Stats from Telemetry
A natural question arises: Are Google Play Game Stats and GA4 Telemetry completely separate, or do they overlap?
They overlap substantially—and by design.
Both systems are consumers of the game’s internal GameEventBusService:
- Google Play Game Stats v1 is a single-event career projection. It packages up everything that happened in a finished match into one compact
war_completedevent with 20 properties, specifically tailored for Google Play Console’s repetitive-stat limits. - GA4 Gameplay Telemetry is a fine-grained domain stream. It emits specific records at specific moments:
war_started,turn_started,comparison_resolved,reinforcement_resolved,battle_started,achievement_observed, andwar_resolved.
Because the underlying domain truths are identical, every single one of our 11 Google Play stats can be derived directly from our GA4 telemetry:
- Volume and Win Rates: Google Play’s
wars_foughtandwars_wonmap directly to GA4’swar_resolvedcount (38) andoutcome == 'player_win'filter (17). - Comebacks: Google Play tracks
comeback_victories(wins after a $\ge 3$ card deficit) andgreatest_comeback(maximum deficit overcome). In GA4,war_resolvedcarriescomeback_deficit, capturing our 4 comeback victories and our 6-card record. - Battles and Depth: Google Play’s
battles_fought(54) anddeepest_battle(Layer 3) correspond to GA4’sbattle_startedevents andlayerRoundparameters. - The Core Decision: Google Play aggregates
reinforcements_sent(72) andsuccessful_reinforcements(38). GA4 records every individualreinforcement_resolvedcomparison, revealing the exact 52.8% human rescue rate. - Aces Felled by Twos: Google Play accumulates every opponent Ace felled by a Two. In GA4, this is tracked both on
comparison_resolved.two_beats_ace_applied(11 occurrences) and via the rare event achievement observer forwar.wrong_tool_for_job. - Astronomical Anomalies: Google Play sums
anomalies_observed. In GA4,war_resolvedtransmitsanomalies_observed(2 confirmed in our 38 matches), whileachievement_observedlogs each distinct astronomical phenomenon.
In short: we don’t have to wait for Google Play Console to process native device uploads to understand our game’s career metrics. The telemetry stream already gives us the full picture.
The Mystery of the 43.3% (not set)
When you inspect the raw GA4 Attrition - Game Health exploration (toggleable via the switch in the Commander Matchups tab above), your eyes are immediately drawn to row 1:
| Commander | Outcome: (not set) | Outcome: opponent_win | Outcome: player_win | Totals |
|---|---|---|---|---|
| (not set) | 29 | 0 | 0 | 29 |
Out of 67 total rows captured, 29 events—43.3% of the entire table—have neither a commander nor an outcome.
In commercial web analytics, seeing 43% (not set) usually triggers a minor panic: Did the tracking tag break? Are parameters dropping off on iOS? Is there a race condition in the state machine?
Here, the answer is far more interesting: the telemetry schema is doing exactly what it was designed to do.
The 25-Parameter Budget
In Google Analytics 4, every custom event is subject to a strict limit: no event may transmit more than 25 parameters. If a client sends 26 parameters, GA4 does not trim the 26th field; its transport drops the entire event.
In Attrition, rich gameplay events like recursive Battle comparisons (comparison_resolved) or multi-card settlements (settlement_resolved) need to record:
- Common context:
schema_version,ruleset_version,app_version,war_id,campaign_id,campaign_war_index,campaign_mode,campaign_modifiers,event_seq, andturn_number(10 parameters). - Combat parameters:
comparison_stage,player_card_rank,player_card_suit,opponent_card_rank,opponent_card_suit,two_beats_ace_applied,winner,casualties_count,boneyard_count,depth(14 parameters).
That brings the payload to 24 or 25 parameters. Adding commander_id to every event would push critical combat records to 26 parameters, causing GA4 to discard them entirely.
To preserve the parameter budget, we made a deliberate architectural choice documented in our telemetry schema:
commander_idis emitted only on explicit War boundary records:war_started,war_resolved, andwar_abandoned. Intermediate clash, turn, and battle events carrywar_id, allowing BigQuery joins to reconstruct context without bloating GA4 payloads.
The Missing Tab Filter
When you build a Free-form exploration in GA4 with Commander as rows and Outcome as columns without a tab-level filter, GA4 evaluates every single event in the property’s stream.
When a turn_started or UI event enters the pipeline, it has no commander_id and no outcome. GA4 groups it under (not set) × (not set).
The fix is trivial, but essential: add a tab-level filter restricting Event name to war_resolved.
The moment you filter by war_resolved, the 29 intermediate events vanish from the table. What remains is the clean, uncorrupted reality of 38 completed human-vs-AI wars.
What 38 Wars Tell Us About Five Commanders
Thirty-eight games is not a million-game Monte Carlo simulation. But thirty-eight games against real human beings tell us things that a million automated bot matches never could.
Across all 38 matches, human players won 17 Wars (44.7%) and AI commanders won 21 Wars (55.3%). That is a remarkably healthy baseline for a deterministic card game where human players are still learning the nuances of the Mont-Rouge campaign.
The real story, however, emerges when you look at the individual commanders.
1. Matthias von Greyerz: The Overconfident Mathematician (14.3% Win Rate)
In our commander design specifications (opponent-commanders.md), Matthias von Greyerz (analyst) is calibrated as an objective calculator. He weights visible candidate-pool strength higher than anyone else (0.16) and prioritizes clean win probability (56).
On paper, Matthias should be terrifying. In practice against humans, he won 1 match and lost 6 (an 85.7% player win rate).
Why did our best analytical engine collapse so spectacularly?
Because human players do not play like random number generators. Human players understand leverage. When Matthias assesses a 60% probability of rescuing a card, he challenges predictably. Human players bait him into committing high-value reinforcement cards, only to crush him in recursive Battles or starve his remaining reserve. Matthias calculates odds on the current table, but human players calculate three turns ahead.
2. Marcel and Bastien: The Wall of Patience (63.6% & 66.7% Win Rate)
In stark contrast to the Analyst, Marcel de Brie (quartermaster) and Bastien de Herve (attritionist) have been devastating opponents:
- Marcel de Brie: 7 AI wins, 4 player wins (63.6% win rate).
- Bastien de Herve: 6 AI wins, 3 player wins (66.7% win rate).
Marcel values the card at risk above all else (0.84 card value weight) and maintains a tight gamble band. He refuses to commit reserves unless the odds overwhelmingly favor rescue.
Bastien, our itinerant tyromancer, incorporates a massive penalty (-36) for unsupported Battles when his deck is running low. He behaves as if the War is always going to turn 30, husbanding his low cards and forcing human challengers into exhaustion.
Against these two, human aggressiveness has consistently backfired.
3. Lorenzo and Sir Edmund: Chaos and Desperation
Sir Edmund Gloucester (gambler) has lived up to his name: 4 AI wins and 3 player wins (57.1% win rate). With the widest gamble band (1.35) and zero reserve depletion penalty, Edmund swings wildly between heroic rescues and catastrophic double-losses.
Lorenzo di Taleggio (cornered-general) has only faced 4 recorded wars, but took 3 of them (75% win rate). Lorenzo’s strategy carries an extreme desperation modifier (+58) when his deck drops below 3 cards. Players expecting an easy mop-up find Lorenzo counter-attacking with ferocious intensity.
From Exploration to Permanent Architecture
Building this dashboard directly from GA4 metrics teaches three enduring lessons for anyone instrumenting game telemetry:
- Don’t wait for platform perfection: If we had conditioned our visibility on native Google Play Game Stats, we would know nothing about Matthias’s vulnerability today. Building layered, transport-agnostic telemetry pays immediate dividends.
- Respect GA4 parameter economics: Truncating or dropping high-cardinality parameters at the client layer is not a bug; it is the prerequisite for keeping rich 25-parameter domain events alive.
- Explorations require domain filters: Event-scoped parameters require event-scoped exploration filters. Without them, your reports will drown in
(not set). - Platform projections can be verified in advance: Even while Google Play Game Stats v1 waits for native channel verification, our telemetry pipeline allows us to audit every lifetime statistic and rare event frequency against real human play.
The 38 wars recorded here are just the opening skirmishes of the Mont-Rouge campaign. As closed testing expands and more players opt in, we’ll continue piping these records into BigQuery, tracking the elusive 51-turn ceiling, and watching whether Matthias ever learns to stop trusting his math.
Play Attrition · Read the development series · View the telemetry schema · View Google Play Game Stats v1 Contract