Mapping the Gaps in the Materials Project
The Materials Project is an open database run out of Lawrence Berkeley National Laboratory. It holds about 150,000 crystals, each one simulated with quantum physics to predict how it behaves: how stable it is, whether it conducts, how stiff it is. Researchers use it to find candidates for batteries, solar cells, magnets, and almost anything else made of atoms.
It is easy to assume a database that big has computed everything for everything. It hasn’t, and that’s normal: some calculations are much more expensive than others. I wanted to see where the gaps are. So I built the Materials Coverage Atlas, an interactive map of the whole database.
What you’re looking at
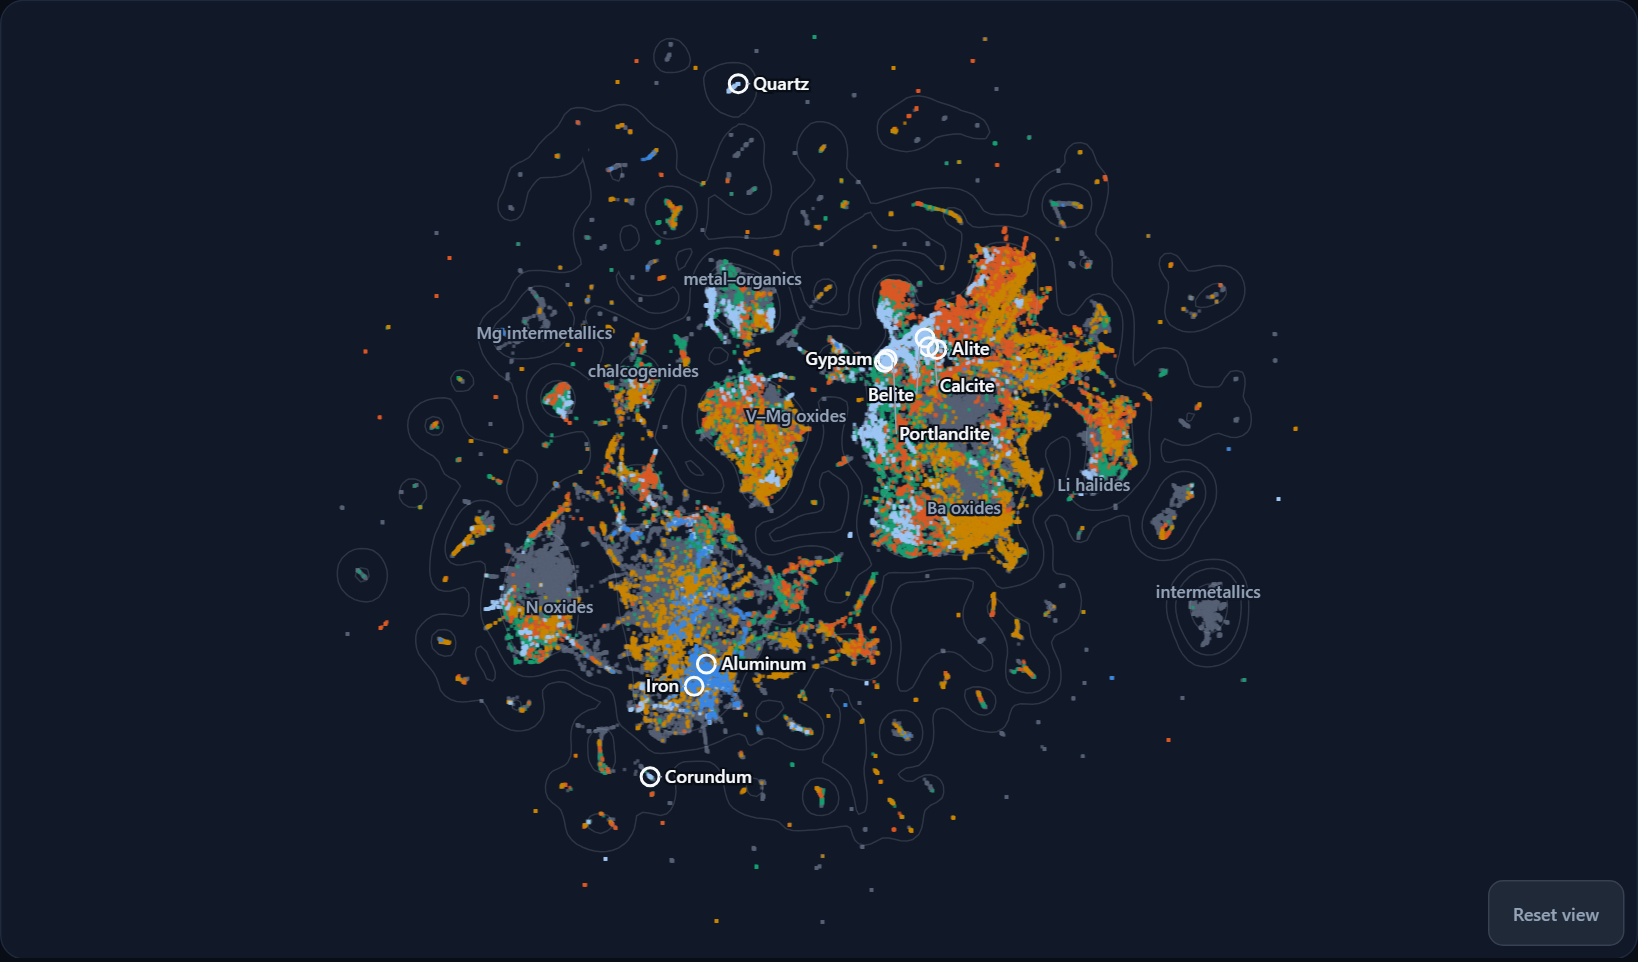
Every dot is one material: a specific compound in a specific crystal arrangement. Each one is described by about 100 traits, such as which elements it contains and in what proportions, plus properties like band gap and density. An algorithm called UMAP flattens those traits onto a 2D page so that similar materials land near each other.
That means the map has no axes. Left and right don’t measure anything. What matters is the neighborhoods: metals and alloys gather in one region, oxides in another, lithium halides off on their own island. The labels name each region after the chemistry most common there.
The white rings are landmarks I picked because most people have touched them: calcite (limestone), gypsum (drywall), portlandite, alite and belite (the main ingredients of cement), quartz (sand), corundum (sapphire), iron, and aluminum.
The colors here are rough categories (structural, energy, electronic/optical, magnetic) from simple rules I wrote and documented in the app. They’re screening heuristics, not predictions, so treat them as a way to get oriented.
Where the data runs thin
Switch the map to Stiffness data and it looks like this:
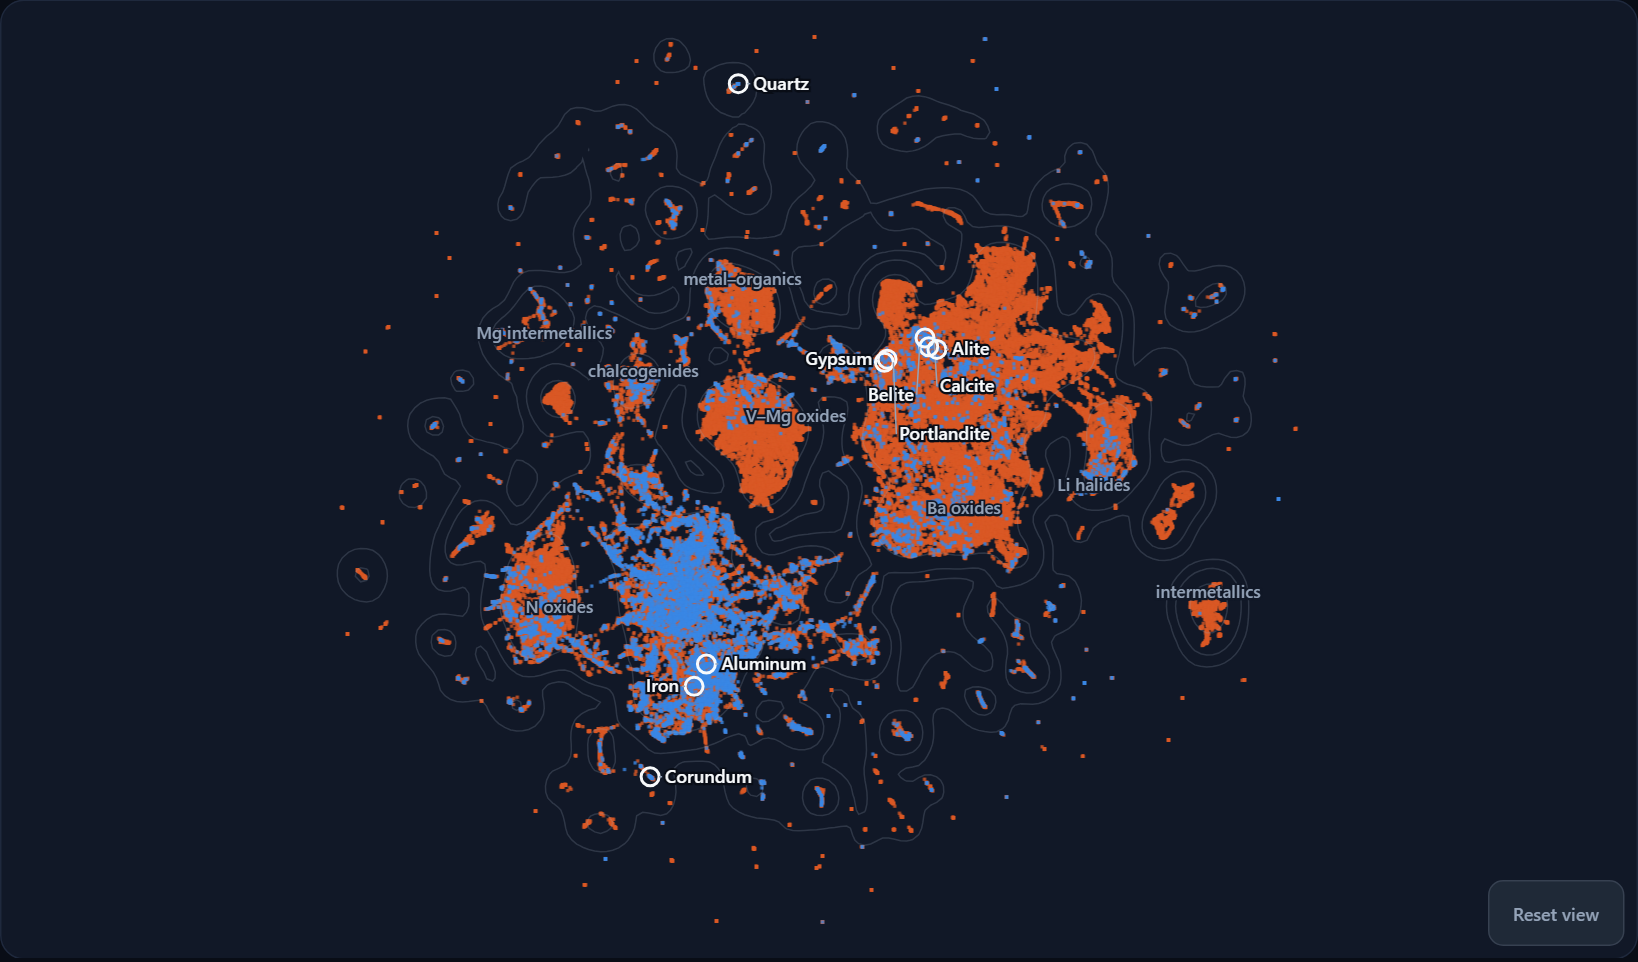
Blue means the Materials Project has computed how stiff the material is (its elastic moduli). Orange means it hasn’t. Across the whole database, only 8.4% of entries have stiffness data.
What surprised me is where the blue is. The metals around iron and aluminum are well covered. The big region of oxides on the right, where the cement and stone landmarks sit, is almost entirely orange. If you’re interested in steel, there’s plenty to go on. If you’re interested in concrete, much less.
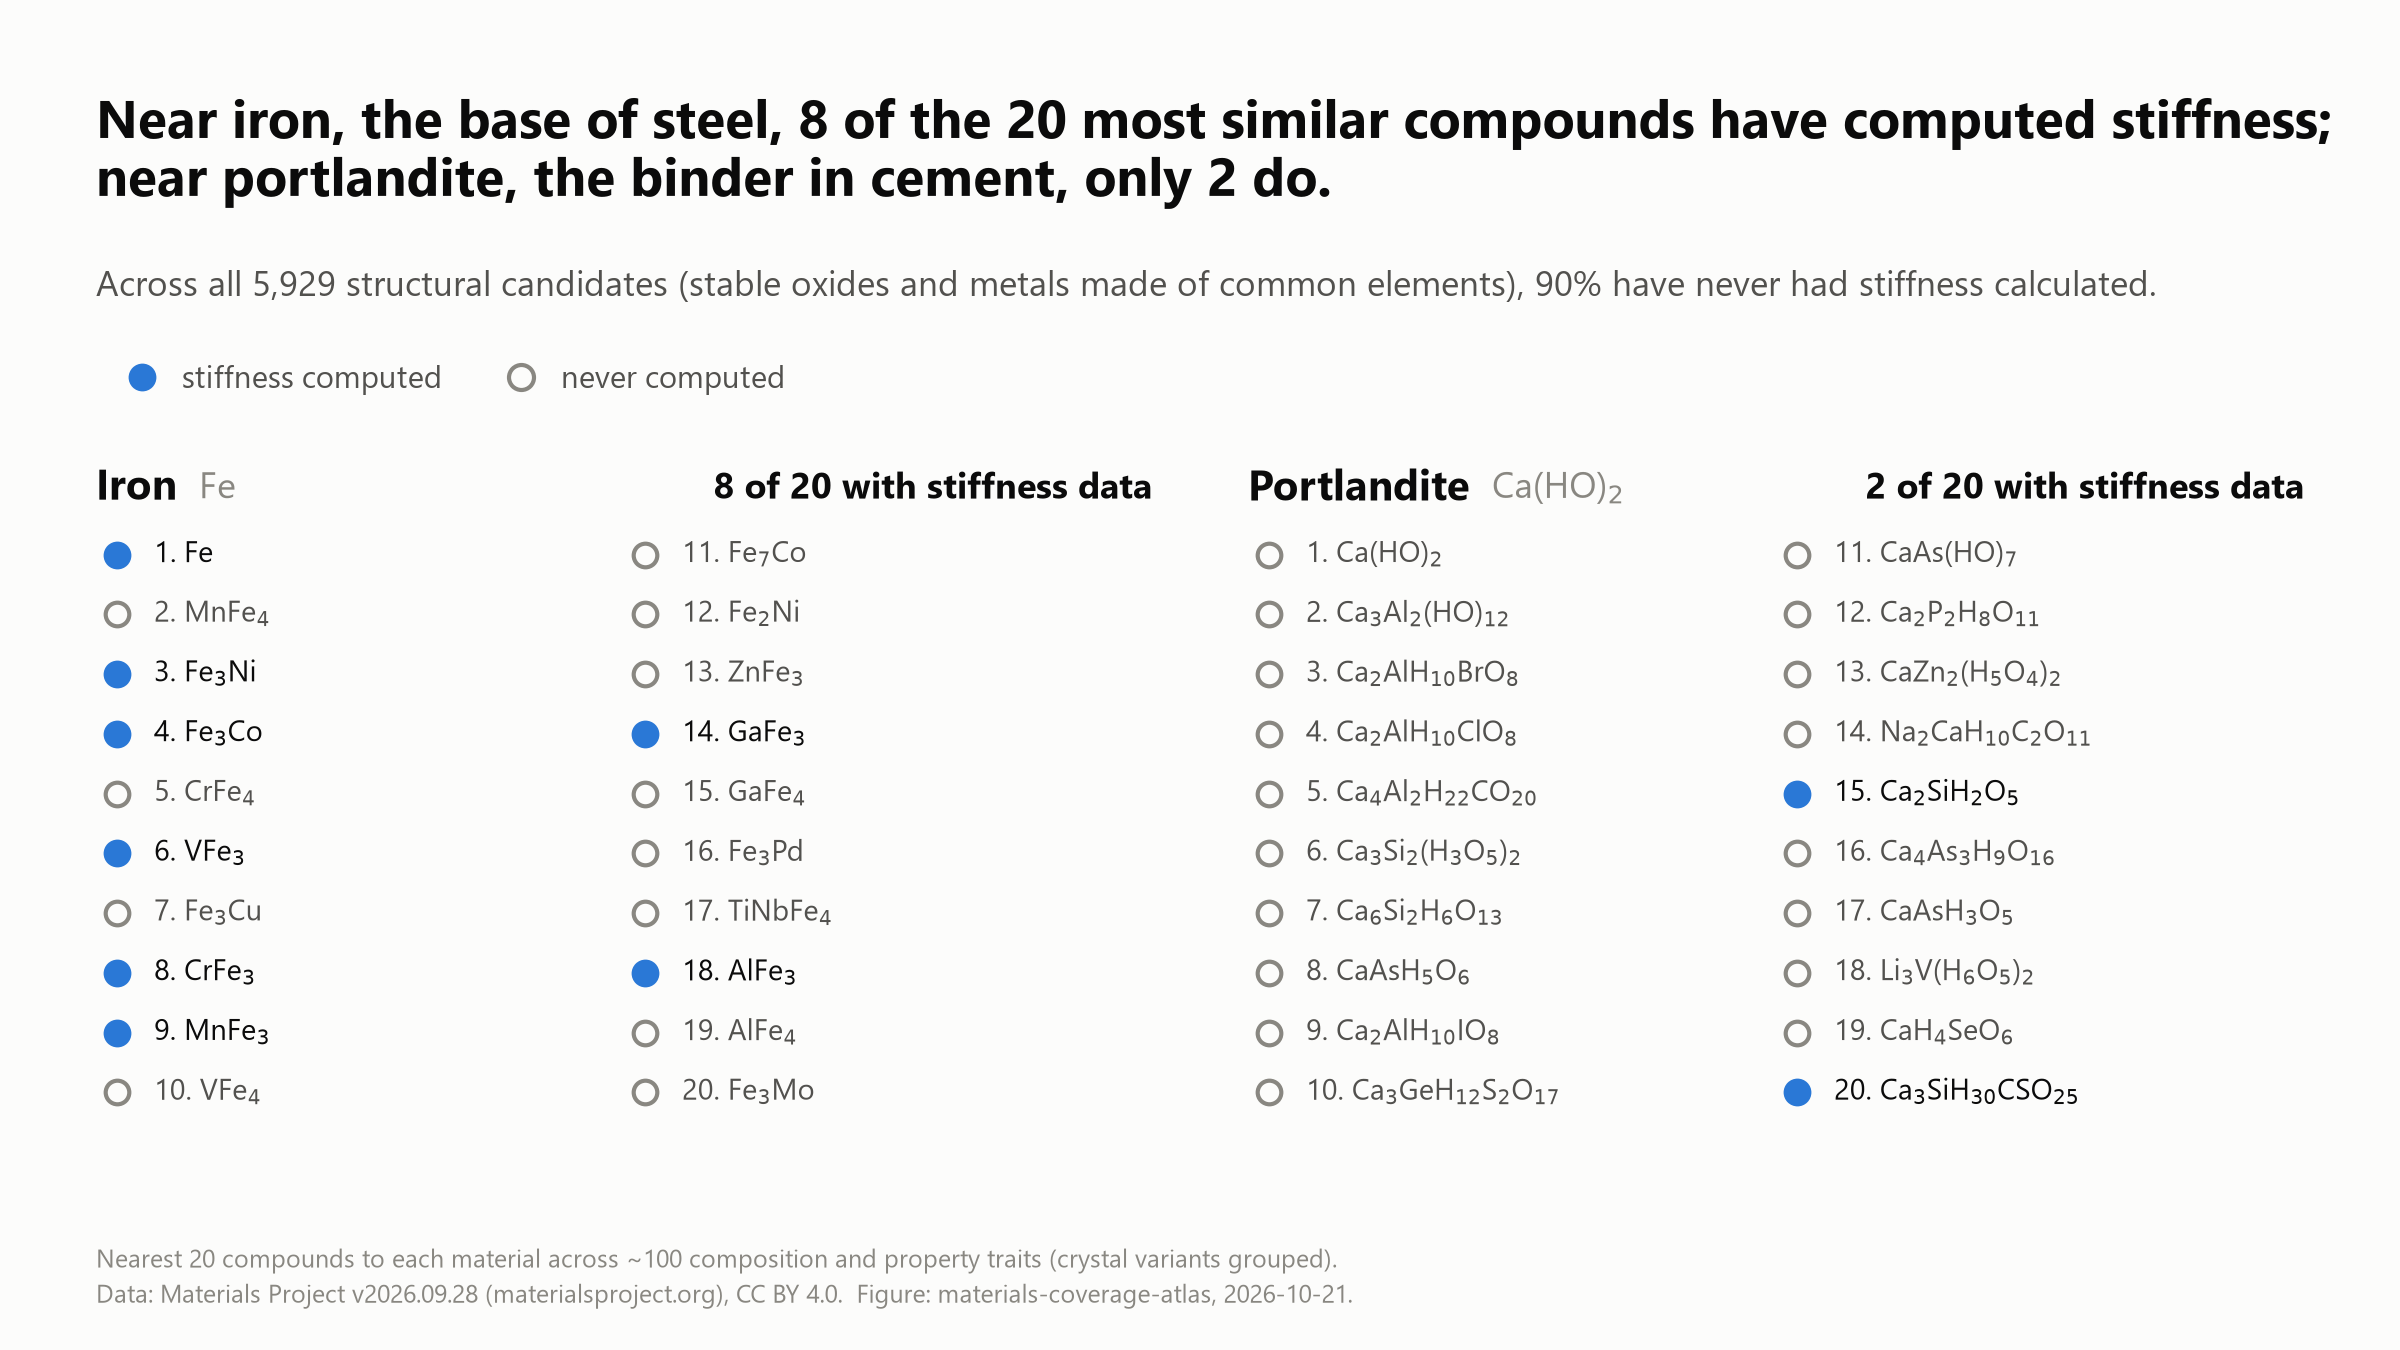
The atlas has a Show similar panel for each landmark that lists its 20 closest materials. This figure compares two of them:
A few more numbers from the same data (Materials Project version 2026.09.28):
- Of the 5,929 “structural candidates” (stable oxides and metals made from common, affordable elements), about 90% have never had stiffness calculated.
- 5,428 materials are, by my rules, one stiffness calculation away from counting as structural. Everything else about them already qualifies.
- Neither of the database’s two entries for gypsum has stiffness data. Neither do any of the three lab-made entries for alite, the main phase in cement clinker.
- Entries added since about 2020 mostly land in neighborhoods that were already crowded. Only 12.8% of them fall in sparse regions, where you’d expect about 25% if they were spread like the older entries.
None of this is a criticism of the Materials Project. Elastic calculations are expensive, and the database is free and remarkably good. It’s just useful to know where the edges are, especially if you’re training a machine-learning model on that data and hoping it applies to cement.
The list
If you want the specifics, here they are: uncovered-neighbors.csv.
For each of the nine landmarks, it lists the materials among its 20 closest neighbors that have no computed stiffness, with their Materials Project IDs and links. That comes to 115 distinct compounds, and 62 of them have been made in a lab. These are real materials, not hypothetical ones. Many of portlandite’s and gypsum’s neighbors are hydrates, such as katoite and Friedel’s salt, the kinds of phases that form as cement sets.
It’s a snapshot of one database version, and a future release might fill some of these in. If it does, that’s good news.
Other things in it
- Overlays for element abundance, element cost, lab-made vs. predicted, newer entries, and “distance from stiffness data,” which shows how far a stiffness estimate would have to stretch from materials that were actually computed.
- Property profiles: a parallel-coordinates view where every material is a line across band gap, formation energy, stability, stiffness, cost and abundance. Drag a range on any axis to filter both the lines and the map. Each axis has a “no data” slot, so you can select exactly the materials that are missing something.
- Why unclassified?: a breakdown of the materials that fit no category, grouped by what’s holding each one back.
- Click any dot to get its card and a link to its page on the Materials Project.
How it’s built
I built this one together with Claude (Opus 5.5, in Claude Code). I brought the questions and made the calls on what to show, and Claude did most of the pipeline and app code, checked the numbers against the data, and helped write this post. It also caught and corrected one of its own early claims before anything went out, which is the kind of help I want.
The site is static. A Python pipeline pulls the data once through the Materials Project API, computes the categories and the UMAP layout, and writes a single JSON file. The browser app is Angular and d3, and it draws all 154,377 points on a canvas. It started from my Angular PWA starter, so it installs on a phone and, once you’ve opened it, works offline like the others in the directory.
The data is licensed CC BY 4.0, so the attribution and database version are shown on every page. The code is MIT. I’m not affiliated with the Materials Project.
Caveats
- The categories are rules of thumb applied to computed values. The band gaps in particular come from a method that usually underestimates experiment.
- “No stiffness data” means not computed yet, not “zero” and not “soft.”
- Element cost is the raw price of the elements by weight. It ignores processing, so it’s a floor.
- The map is a projection. Neighbors are meaningful; the distance between two far-apart islands mostly isn’t.
We built this over three days in October, and I’m a little proud of it. It might even be useful to people who study materials for a living. If you’re one of them and something here is wrong, or useful, I’d like to hear about it.
— Chris